01 - Debug
This lab will teach you how to debug and run programs written in Rust and embassy on the STM32 Nucleo-U545RE-Q and Raspberry Pi Pico boards.
Concepts
- How to debug a microcontroller's firmware
- How the binary of the firmware looks like and how to inspect it
- How to cross-compile Rust software
- How to use
probe-rsfor STM32/RP2 processors - How to print messages from a microcontroller
- How to use the Visual Studio Code probe-rs extension
Resources
- STMicroelectronics, STM32U545 Datasheet
- Chapter 4: Boot modes
- Chapter 5: Global TrustZone controller
- Chapter 75: Debug support
- STMicroelectronics, STM32U545 Reference Manual
- Raspberry Pi Ltd, RP2350 Datasheet
- Chapter 4 - Memory
- Section 4.1 - ROM
- Section 4.2 - SRAM
- Section 4.3 - Boot RAM
- Chapter 5 - Bootrom
Software Prerequisites
Please make sure that you have these installed.
- Rust
- Rust ARMv8-M target -
rustup target add thumbv8m.main-none-eabihf - probe-rs
- cargo binutils -
cargo install cargo-binutils - Rust LLVM Tools -
rustup component add llvm-tools - Visual Studio Code
Debugger
Developing software (firmware1) on devices is a little different from standard computer applications. The main difference is that the software is developed and compiled on the computer and then uploaded and run on a separate device.
Each development board defines its own way of uploading software to it. Some boards, like the STM32s or Raspberry Pi Picos, provide a simulated USB drive where users can copy a file, others, like the ESP32 boards, provide a WiFi Access Point and a web interface.
One method that all boards have in common is using the debug interface. Microcontrollers provide a special hardware interface for debugging purposes. Using specialized hardware, developers can:
- stop the processor any time
- ask the processor to execute one instruction at a time
- read and write the processor's memory (RAM)
- read and write the processor's Flash (Storage)
- read the processor's registers
- access special debugging interfaces for sending log messages
These functions allow developers to upload programs and observe the program's behavior.
There are several debugging protocols available, the most common of them being JTAG and SWD. The RP2 processors use SWD.
When placed in production, the debug interface should be disabled. Users of the production device should never be able to access such an interface and tamper with the device's program.
Each microcontroller offers a way in which the debug interface can be permanently disabled or restricted.
- STM32 Nucleo-U545RE-Q
- Raspberry Pi Pico/Raspberry Pi Pico 2
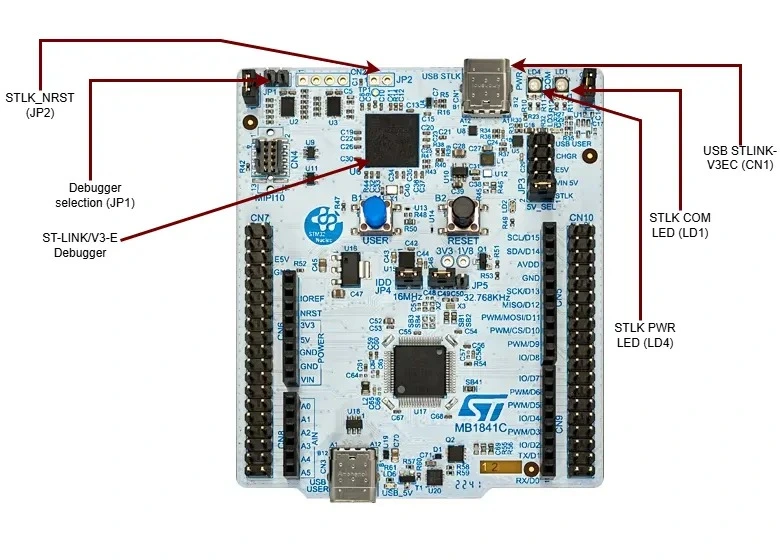
ST-LINK/V3SET Debug Probe
The Nucleo-STM32U545RE-Q development board can be debugged using the following methods:
- On-board ST-LINK/V3-E Debugger (included with the Nucleo board)
- External SWD Debug Probe (optional, if bypassing or replacing the on-board debugger)
Professional debuggers, while offering a lot of features, are usually expensive. STMicroelectronics provides the ST-LINK/V3SET, an affordable and versatile in-circuit debugger and programmer designed specifically for STM32 microcontrollers.
The ST-LINK firmware is maintained by ST and is regularly updated through STM32CubeProgrammer. It is proprietary but widely supported across ST’s software ecosystem, including STM32CubeIDE, OpenOCD, and many others third-party options.
Unlike custom open-source probes, the ST-LINK hardware and firmware are tightly integrated with STM32 development tools and come with professional-grade features like drag-and-drop programming (in mass storage mode), high-speed transfers, and support for multiple power configurations.
If using an external ST-LINK device, please refer to the ST-LINK/V3SET’s user manual which includes details on connecting to SWD/JTAG interfaces.
Raspberry Pi Debug Probe
The Raspberry Pi Pico can be debugged using one of the two pieces of hardware:
- The Raspberry Pi Debug Probe
- A secondary Raspberry Pi Pico
Professional debuggers, while offering a lot of features, are usually expensive. Raspberry Pi provides the Debug Probe, an affordable debug device that uses an RP2040 processor. It is similar to a Raspberry Pi Pico board, just that it has a smaller form factor and provides debug cables.
The firmware running on the debug device is open source and available on github. It is written in C and it uses FreeRTOS. It is compatible with both versions of the RP2 processors, RP2040 and RP2350.
The details about the wiring are available on the Pico Debug Probe's website.
Secondary Pico
As the debugger's firmware is open source, an additional Raspberry Pi Pico can be used as a debugger.
The details about the wiring are available in the Getting started with Raspberry Pi Pico-series in the Debug with a second Pico or Pico 2 section.
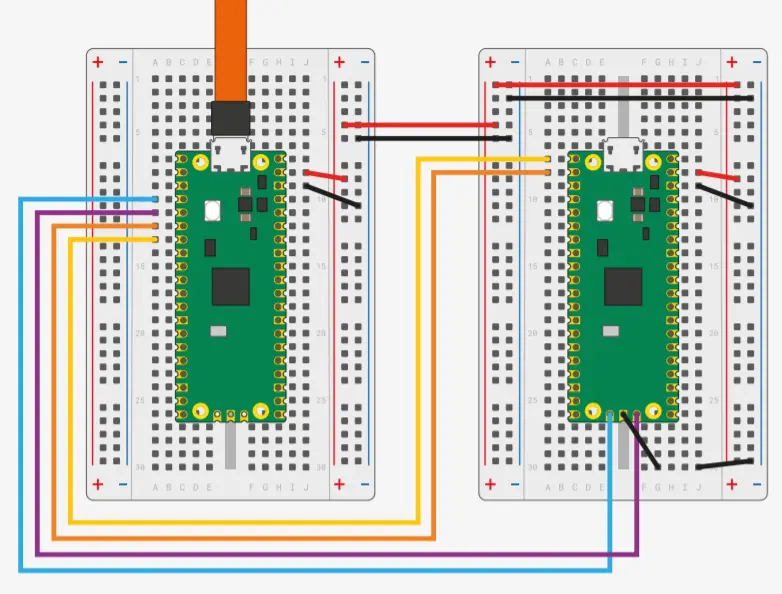
The lab board uses RP2040 processor soldered to the PCB as a debugger. It runs the debugprobe firmware and has traces soldered to Raspberry Pi Pico's socket.
Debugger software
Hardware debuggers require specialized software on the host computer (the computer used for development) to communicate with and control the target device (the Raspberry Pi Pico 2/STM32 Nucleo-U545RE-Q in this case). These software tools provide essential debugging capabilities, such as setting breakpoints, inspecting memory, and stepping through code execution. While most debugger vendors offer proprietary software tailored to their specific hardware, developers often seek more flexible or platform-independent solutions. Fortunately, there are several open-source alternatives that support a wide range of debugging probes and microcontrollers.
One widely used open-source tool is OpenOCD, which provides a powerful and configurable interface for debugging and programming ARM and RISC-V devices, including the STM32 Nucleo-U545RE-Q and Raspberry Pi Pico 2. OpenOCD supports a variety of debug probes and allows integration with GDB for source-level debugging.
Another popular option is PyOCD, a Python-based tool designed primarily for ARM Cortex-M microcontrollers. It offers an easy-to-use command-line interface, built-in support for CMSIS-DAP debug probes, and seamless integration with debugging environments like GDB and Visual Studio Code.
For developers working in Rust or looking for an alternative that is optimized for modern workflows, probe-rs provides a Rust-based debugging and flashing tool that supports multiple probe types, including CMSIS-DAP and J-Link. It offers a simple API, making it a great choice for both manual debugging and automated workflows.
Cross-compiling
Cross-compiling is the process of building software on one system (the host) that is intended to run on a different system (the target). This is necessary when developing for embedded systems like the STM32 Nucleo-U545RE-Q or Raspberry Pi Pico 2 because the target device has a different processor architecture than the development computer. Unlike normal compiling, where the compiled binary runs on the same system that builds it, cross-compiling generates machine code suitable for the target architecture.
In Rust, this is handled by specifying a target triple.
For example, when using cargo build for embedded development, Rust compiles
the firmware for the microcontroller's architecture and flashes it to the
device.
For example, cross-compiling for the STM32 Nucleo-U545RE-Q requires the
thumbv8m.main-none-eabihf triple. It tells the compiler to build code
for:
- the ARMv8-M Mainline (
thumbv8m.main) architecture - that runs bare metal, without an operating system available (
none) - and uses the Embedded Application Binary Interface (
eabi) with hardware floating point support
cargo build --target thumbv8m.main-none-eabihf
The Raspberry Pi Pico 2 uses the same target triple as the STM32 Nucleo-U545RE-Q (thumbv8m.main-none-eabihf). This means you can build for the Pico 2 using the exact same command shown above.
Using a configuration file
Instead of providing the target triple in the command line every time, cargo offers the
possibility of writing it in a configuration file called .cargo/config.toml.
[build]
target = "thumbv8m.main-none-eabihf"
This sets the default compilation target to thumbv8m.main-none-eabihf,
ensuring that cargo always builds the project for an ARMv8-M Mainline
microcontroller with hardware floating-point support.
With this setting, running cargo build or cargo run automatically
compiles for the specified target, making cross-compilation seamless.
The target triple for the Raspberry Pi Pico 1 is thumbv6m-none-eabi.
Binary format
To be able to properly run the code, both the STM32 Nucleo-U545RE-Q microcontrollers and the Raspberry Pi Pico (1 and 2) expect the binary to follow a specific format defined by their memory map and startup sequence. The compiler and linker, provided by Rust, must ensure that the generated binary places the required regions correctly and meets the device’s format requirements. Otherwise, the microcontroller will fail to start.
Sections
The binary file is generated as a collection of sections. Each section has:
- size (in bytes)
- the address of the section in RAM when the firmware runs (
VMA, Virtual Memory Address) - the address of the section when it is stored into flash (
LMA, Load Memory Address) - the type
Section types
| Type | Description |
|---|---|
| TEXT | Contains the binary code the the processor executes |
| DATA | Contains data used by the firmware, usually variables |
| BSS | Contains uninitialized or initialized with 0 data, usually uninitialized global variables and variables initialized to 0 |
| DEBUG | Contains debug information used by the debugger software. |
DEBUG type sections have no addresses (0x00000000), as they are never loaded to the device. These sections
are used by the debugging software to display meaningful information to developers. Among the information
store here we can find:
- source code to binary code mappings
- variable name mappings
- function name mappings
- STM32 Nucleo-U545RE-Q
- Raspberry Pi Pico/Raspberry Pi Pico 2
The binary file for the STM32U545 is organized to ensure proper execution and booting, with specific sections for the developer’s code and variables. At the very beginning of flash memory lies the .vector_table, which contains the reset handler and interrupt vectors required by the Cortex‑M33 core. Immediately following this, the .text section holds the developer’s executable instructions that make up the application’s logic. This section is stored in flash memory and is executed directly from there when the system starts. It is the core of the firmware, containing the main program logic.
Following the .text section, the .data section contains initialized global and static variables. These variables are stored in flash memory but are copied into RAM during startup so that they can be modified at runtime. The developer’s predefined values for global variables are preserved here. In contrast, the .bss section holds uninitialized variables. These are allocated in RAM and automatically zeroed out during the boot process, ensuring they are ready for use by the application.
The .rodata section follows, storing read‑only data such as string literals and constant values. These are kept in flash memory, conserving RAM while still allowing the program to access them efficiently throughout execution.
The binary file for the Raspberry Pi Pico 2 is organized to ensure proper
execution and booting, with specific sections for the developer's code and
variables. The first section that holds the developer’s code is the .text
section. This section contains all the executable instructions that make up
the application’s logic. It is located after the .start_block and
.vector_table sections, and it is placed into flash memory, ready to
be loaded and executed when the system starts. This is where the developer's
main program logic resides.
Following the .text section, the .data section contains
initialized global and static variables. These variables are stored in flash
memory and are copied into RAM at startup. The developer’s predefined values
for global variables are stored here, so they can be used during runtime.
In contrast, the .bss section holds uninitialized variables. These
variables are zeroed out during the boot process and are stored in RAM to
ensure that the program can access them during execution.
The .rodata section follows, storing read-only data like string literals
and constant values. These values are also stored in flash memory and are used
throughout the application without modification. The .rodata section
helps to conserve RAM by storing constant data in the flash memory instead.
Once the developer’s code and variables are in place, the firmware image ends
with the .end_block section. This section marks the end of the firmware
and ensures that no additional data is written past this point. It is important
for memory management, preventing the accidental overwrite of critical memory
regions during updates or execution.
Linker Script
The compiler is responsible for generating the sections and the linker is responsible for
putting the sections in the right place in the binary. Rust uses a linker script to
instruct the linker where to put the sections. The linker script is usually called
memory.x and is located in the firmware's root folder.
The linker script is in the firmware's crate root folder, not in the src folder.
- STM32 Nucleo-U545RE-Q
- Raspberry Pi Pico 2
- Raspberry Pi Pico
MEMORY
{
  /* On-chip Flash memory */
  FLASH (rx) : ORIGIN = 0x08000000, LENGTH = 512K

  /* On-chip SRAM (SRAM1+SRAM2+SRAM3 combined) */
  RAM (rwx)  : ORIGIN = 0x20000000, LENGTH = 256K
}
MEMORY {
    /*
     * The RP2350 has either external or internal flash.
     *
     * 2 MiB is a safe default here, although a Pico 2 has 4 MiB.
     */
    FLASH : ORIGIN = 0x10000000, LENGTH = 2048K
    /*
     * RAM consists of 8 banks, SRAM0-SRAM7, with a striped mapping.
     * This is usually good for performance, as it distributes load on
     * those banks evenly.
     */
    RAM : ORIGIN = 0x20000000, LENGTH = 512K
    /*
     * RAM banks 8 and 9 use a direct mapping. They can be used to have
     * memory areas dedicated for some specific job, improving predictability
     * of access times.
     * Example: Separate stacks for core0 and core1.
     */
    SRAM4 : ORIGIN = 0x20080000, LENGTH = 4K
    SRAM5 : ORIGIN = 0x20081000, LENGTH = 4K
}

SECTIONS {
    /* ### Boot ROM info
     *
     * Goes after .vector_table, to keep it in the first 4K of flash
     * where the Boot ROM (and picotool) can find it
     */
    .start_block : ALIGN(4)
    {
        __start_block_addr = .;
        KEEP(*(.start_block));
        KEEP(*(.boot_info));
    } > FLASH

} INSERT AFTER .vector_table;

/* move .text to start /after/ the boot info */
_stext = ADDR(.start_block) + SIZEOF(.start_block);

SECTIONS {
    /* ### Picotool 'Binary Info' Entries
     *
     * Picotool looks through this block (as we have pointers to it in our
     * header) to find interesting information.
     */
    .bi_entries : ALIGN(4)
    {
        /* We put this in the header */
        __bi_entries_start = .;
        /* Here are the entries */
        KEEP(*(.bi_entries));
        /* Keep this block a nice round size */
        . = ALIGN(4);
        /* We put this in the header */
        __bi_entries_end = .;
    } > FLASH
} INSERT AFTER .text;

SECTIONS {
    /* ### Boot ROM extra info
     *
     * Goes after everything in our program, so it can contain a signature.
     */
    .end_block : ALIGN(4)
    {
        __end_block_addr = .;
        KEEP(*(.end_block));
    } > FLASH

} INSERT AFTER .uninit;

PROVIDE(start_to_end = __end_block_addr - __start_block_addr);
PROVIDE(end_to_start = __start_block_addr - __end_block_addr);
MEMORY {
    BOOT2 : ORIGIN = 0x10000000, LENGTH = 0x100
    /*
     * Here we assume you have 2048 KiB of Flash. This is what the Pi Pico
     * has, but your board may have more or less Flash and you should adjust
     * this value to suit.
     */
    FLASH : ORIGIN = 0x10000100, LENGTH = 2048K - 0x100
    /*
     * RAM consists of 4 banks, SRAM0-SRAM3, with a striped mapping.
     * This is usually good for performance, as it distributes load on
     * those banks evenly.
     */
    RAM : ORIGIN = 0x20000000, LENGTH = 256K
    /*
     * RAM banks 4 and 5 use a direct mapping. They can be used to have
     * memory areas dedicated for some specific job, improving predictability
     * of access times.
     * Example: Separate stacks for core0 and core1.
     */
    SRAM4 : ORIGIN = 0x20040000, LENGTH = 4k
    SRAM5 : ORIGIN = 0x20041000, LENGTH = 4k

    /* SRAM banks 0-3 can also be accessed directly. However, those ranges
       alias with the RAM mapping, above. So don't use them at the same time!
    SRAM0 : ORIGIN = 0x21000000, LENGTH = 64k
    SRAM1 : ORIGIN = 0x21010000, LENGTH = 64k
    SRAM2 : ORIGIN = 0x21020000, LENGTH = 64k
    SRAM3 : ORIGIN = 0x21030000, LENGTH = 64k
    */
}

EXTERN(BOOT2_FIRMWARE)

SECTIONS {
    /* ### Boot loader
     *
     * An executable block of code which sets up the QSPI interface for
     * 'Execute-In-Place' (or XIP) mode. Also sends chip-specific commands to
     * the external flash chip.
     *
     * Must go at the start of external flash, where the Boot ROM expects it.
     */
    .boot2 ORIGIN(BOOT2) :
    {
        KEEP(*(.boot2));
    } > BOOT2
} INSERT BEFORE .text;

SECTIONS {
    /* ### Boot ROM info
     *
     * Goes after .vector_table, to keep it in the first 512 bytes of flash,
     * where picotool can find it
     */
    .boot_info : ALIGN(4)
    {
        KEEP(*(.boot_info));
    } > FLASH

} INSERT AFTER .vector_table;

/* move .text to start /after/ the boot info */
_stext = ADDR(.boot_info) + SIZEOF(.boot_info);

SECTIONS {
    /* ### Picotool 'Binary Info' Entries
     *
     * Picotool looks through this block (as we have pointers to it in our
     * header) to find interesting information.
     */
    .bi_entries : ALIGN(4)
    {
        /* We put this in the header */
        __bi_entries_start = .;
        /* Here are the entries */
        KEEP(*(.bi_entries));
        /* Keep this block a nice round size */
        . = ALIGN(4);
        /* We put this in the header */
        __bi_entries_end = .;
    } > FLASH
} INSERT AFTER .text;
Build Script
To connect the linker script (memory.x) to the compiler, Rust uses the build.rs file
located in the root of the firmware's crate.
The build.rs file is located in the root of the firmware's crate, not in the src folder.
The build.rs file compiles before the firmware and is executed by the Rust compiler during
the compilation. The build.rs file writes to the screen compiler options that the compiler
later uses for the building of the firmware.
//! This build script copies the `memory.x` file from the crate root into
//! a directory where the linker can always find it at build time.
//! For many projects this is optional, as the linker always searches the
//! project root directory -- wherever `Cargo.toml` is. However, if you
//! are using a workspace or have a more complicated build setup, this
//! build script becomes required. Additionally, by requesting that
//! Cargo re-run the build script whenever `memory.x` is changed,
//! updating `memory.x` ensures a rebuild of the application with the
//! new memory settings.

use std::env;
use std::fs::File;
use std::io::Write;
use std::path::PathBuf;

fn main() {
    // Put `memory.x` in our output directory and ensure it's
    // on the linker search path.
    let out = &PathBuf::from(env::var_os("OUT_DIR").unwrap());
    File::create(out.join("memory.x"))
        .unwrap()
        .write_all(include_bytes!("memory.x"))
        .unwrap();
    println!("cargo:rustc-link-search={}", out.display());

    // By default, Cargo will re-run a build script whenever
    // any file in the project changes. By specifying `memory.x`
    // here, we ensure the build script is only re-run when
    // `memory.x` is changed.
    println!("cargo:rerun-if-changed=memory.x");

    println!("cargo:rustc-link-arg-bins=--nmagic");
    println!("cargo:rustc-link-arg-bins=-Tlink.x");
    // Required for `defmt`
    println!("cargo:rustc-link-arg-bins=-Tdefmt.x");
}
This example instructs the linker to use:
- the project's linker script -
memory.x - the
cortex-m-rtlinker script -link.x - the
defmt's linker script -defmt.x
Inspect binaries
- STM32 Nucleo-U545RE-Q
- Raspberry Pi Pico 2
- Raspberry Pi Pico
When working in Rust for the STM32 Nucleo-U545RE-Q, tools such as rust-objdump can be used to inspect the compiled binary and analyze its memory layout. The output includes various sections that are crucial for embedded development.
| Section | Fixed Offset | Description |
|---|---|---|
.vector_table | 0x08000000 | Reset vector and interrupt table. The CPU fetches the initial stack pointer and reset handler from here after reset. |
.text | 0x08000238 | Stores executable code, typically placed in flash memory. Optimizing this section can reduce flash usage and improve execution efficiency. |
.rodata | 0x080112F0 | Contains read-only data, such as string literals and constants, stored in flash memory. Helps minimize RAM usage. |
.data | 0x20000000 (load image at 0x08014780) | Includes initialized variables that are stored in flash and copied to RAM during startup. Used for global and static variables requiring predefined values. |
.bss | 0x20000050 | Represents uninitialized variables that are zeroed out in RAM before execution. Large .bss sections can impact RAM availability. |
When working in Rust for the Raspberry Pi Pico 2, rust-objdump can be used to
inspect the compiled binary and examine its memory layout. The output includes
various sections that are crucial for embedded development.
| Section | Fixed Offset | Description |
|---|---|---|
.vector_table | 0x10000000 | Contains the initial stack pointer value and interrupt vector table. Essential for system startup and exception handling, allowing the processor to correctly respond to interrupts. |
.start_block | 0x10000114 | Holds boot metadata, including information needed by the bootloader to validate and execute the firmware correctly. Ensures that the correct application runs after a reset. |
.text | N/A | Stores executable code, typically placed in flash memory. Optimizing this section can reduce flash usage and improve execution efficiency. |
.rodata | N/A | Contains read-only data, such as string literals and constants, stored in flash memory. Helps minimize RAM usage. |
.data | N/A | Includes initialized variables that are stored in flash and copied to RAM during startup. Used for global and static variables requiring predefined values. |
.bss | N/A | Represents uninitialized variables that are zeroed out in RAM before execution. Large .bss sections can impact RAM availability. |
.bi_entries | N/A | Contains boot information entries used by the RP2350 ROM bootloader and firmware updater to manage and validate firmware images. |
.end_block | N/A | Marks the end of the firmware image. This section helps bootloaders determine the total size of the firmware and ensures that no unexpected data is included beyond this point. It is used for integrity checks and defining boundaries for updates or memory protection. |
When working in Rust for the Raspberry Pi Pico, rust-objdump can be used to
inspect the compiled binary and examine its memory layout. The output includes
various sections that are crucial for embedded development.
| Section | Fixed Offset | Description |
|---|---|---|
.vector_table | 0x10000100 | Contains the initial stack pointer value and interrupt vector table. Essential for system startup and exception handling, allowing the processor to correctly respond to interrupts. |
.boot_info | 0x100001C0 | Contains boot metadata used by the ROM bootloader to validate and launch the firmware. |
.boot2 | 0x10000000 | The second-stage bootloader. This is the first code executed after reset, responsible for preparing the system and jumping into user firmware. |
.text | N/A | Stores executable code, typically placed in flash memory. Optimizing this section can reduce flash usage and improve execution efficiency. |
.bi_entries | 0x10002998 | Contains boot information entries used by the RP2350 ROM bootloader and firmware updater to manage and validate firmware images. |
.rodata | N/A | Contains read-only data, such as string literals and constants, stored in flash memory. Helps minimize RAM usage. |
.data | N/A | Includes initialized variables that are stored in flash and copied to RAM during startup. Used for global and static variables requiring predefined values. |
.bss | N/A | Represents uninitialized variables that are zeroed out in RAM before execution. Large .bss sections can impact RAM availability. |
Pico 1 vs Pico 2 vs STM32 Nucleo-U545RE-Q
The primary difference between the Raspberry Pi Pico 1 and Pico 2 in terms of firmware layout is the presence of the .boot2 section in the Pico 1, which is not present in the Pico 2. The .boot2 section in the Pico 1 is located at a fixed offset of 0x10000000 and contains the bootloader code along with necessary metadata for bootstrapping the device.
The .vector_table section in the Pico 1 is placed immediately after the .boot2 section, unlike the Pico 2 where it is located at the beginning of the flash memory at 0x00000000.
The Pico 2 uses the .start_block and .end_block sections to handle boot metadata and firmware boundaries, while the Pico 1 relies on the bootloader for these tasks. Furthermore, the Pico 1 does not have a fixed .end_block section, which is used in the Pico 2 to mark the end of the firmware image.
By contrast, the STM32U545 series follows a more traditional ARM Cortex‑M layout. The .vector_table is always located at the start of Flash (0x08000000 by default), and there is no .boot2, .start_block, or .end_block section unless the developer explicitly defines them for a custom bootloader or secure‑boot scheme. Instead, STM32 devices rely on their built‑in system bootloader (in ROM) and the standard ARM exception model. Sections such as .text, .rodata, .data, and .bss are placed in Flash and SRAM according to the linker script, with optional regions like .uninit or .gnu.sgstubs (for TrustZone) depending on the project.
Despite these differences, all three platforms — Pico 1, Pico 2, and STM32U545 — share the same fundamental structure of executable code in Flash and runtime data in SRAM, with the familiar .text, .rodata, .data, and .bss sections serving their usual roles in embedded development.
Check section headers
If the uploaded firmware does not boot, looking at the firmware's sections is useful.
The rust-objdump tool can be used to inspect firmware binaries. Using the --section-headers
flag will display the sections of the firmware.
- STM32 Nucleo-U545RE-Q
- Raspberry Pi Pico 2
- Raspberry Pi Pico
rust-objdump --section-headers target/thumbv8m.main-none-eabihf/debug/$app_name
Make sure that:
- section
.vector_tableis0x238long and at0x80000000
Sections:
Idx Name            Size     VMA      LMA      Type
  0                 00000000 00000000 00000000
  1 .vector_table   00000238 08000000 08000000 DATA
  2 .text           000110b4 08000238 08000238 TEXT
  3 .rodata         0000348c 080112f0 080112f0 DATA
  4 .data           00000050 20000000 08014780 DATA
  5 .gnu.sgstubs    00000000 080147e0 080147e0 DATA
  6 .bss            0001819c 20000050 20000050 BSS
  7 .uninit         00000400 200181ec 200181ec BSS
  8 .defmt          00000030 00000000 00000000
  9 .debug_abbrev   0000dfc8 00000000 00000000 DEBUG
 10 .debug_info     00187084 00000000 00000000 DEBUG
 11 .debug_aranges  00011180 00000000 00000000 DEBUG
 12 .debug_ranges   0002a698 00000000 00000000 DEBUG
 13 .debug_str      001e097a 00000000 00000000 DEBUG
 14 .comment        0000008b 00000000 00000000
 15 .ARM.attributes 0000003a 00000000 00000000
 16 .debug_frame    00032f20 00000000 00000000 DEBUG
 17 .debug_line     0009313e 00000000 00000000 DEBUG
 18 .debug_loc      00002dbc 00000000 00000000 DEBUG
 19 .symtab         00009c00 00000000 00000000
 20 .shstrtab       000000dd 00000000 00000000
 21 .strtab         00018095 00000000 00000000
rust-objdump --section-headers target/thumbv8m.main-none-eabihf/debug/$app_name
Make sure that:
- section
.vector_tableis0x114long and at0x10000000 - section
.start_blockis at0x10000114 - section
.end_blockexists
Sections:
Idx Name            Size     VMA      LMA      Type
  0                 00000000 00000000 00000000
  1 .vector_table   00000114 10000000 10000000 DATA
  2 .start_block    00000028 10000114 10000114 DATA
  3 .text           0000b190 1000013c 1000013c TEXT
  4 .bi_entries     00000010 1000b2cc 1000b2cc DATA
  5 .rodata         000030e4 1000b2e0 1000b2e0 DATA
  6 .data           00000488 20000000 1000e3c4 TEXT
  7 .gnu.sgstubs    00000000 1000e860 1000e860 DATA
  8 .bss            000181bc 20000488 20000488 BSS
  9 .uninit         00000400 20018644 20018644 BSS
 10 .end_block      00000000 1000e860 1000e860 DATA
 11 .defmt          00000023 00000000 00000000
 12 .debug_abbrev   0000b8bb 00000000 00000000 DEBUG
 13 .debug_info     000ea40f 00000000 00000000 DEBUG
 14 .debug_aranges  00009a70 00000000 00000000 DEBUG
 15 .debug_ranges   00032380 00000000 00000000 DEBUG
 16 .debug_str      000eff8d 00000000 00000000 DEBUG
 17 .comment        00000099 00000000 00000000
 18 .ARM.attributes 0000003a 00000000 00000000
 19 .debug_frame    0001b444 00000000 00000000 DEBUG
 20 .debug_line     0006ed68 00000000 00000000 DEBUG
 21 .debug_loc      00001e3a 00000000 00000000 DEBUG
 22 .symtab         00007530 00000000 00000000
 23 .shstrtab       00000101 00000000 00000000
 24 .strtab         0000f6ca 00000000 00000000
rust-objdump --section-headers target/thumbv6m-none-eabi/debug/$app_name
Make sure that:
- section
.boot2is0x100long and at0x10000000 - section
.vector_tableis0x0c0long and at0x10000100
Sections:
Idx Name            Size     VMA      LMA      Type
  0                 00000000 00000000 00000000
  1 .vector_table   000000c0 10000100 10000100 DATA
  2 .boot_info      00000000 100001c0 100001c0 DATA
  3 .boot2          00000100 10000000 10000000 DATA
  4 .text           000027d8 100001c0 100001c0 TEXT
  5 .bi_entries     00000000 10002998 10002998 DATA
  6 .rodata         00000d00 10002998 10002998 DATA
  7 .data           00000038 20000000 10003698 DATA
  8 .gnu.sgstubs    00000000 100036e0 100036e0 DATA
  9 .bss            00000008 20000038 20000038 BSS
 10 .uninit         00000400 20000040 20000040 BSS
 11 .defmt          0000000a 00000000 00000000
 12 .debug_abbrev   00005fc3 00000000 00000000 DEBUG
 13 .debug_info     000aa259 00000000 00000000 DEBUG
 14 .debug_aranges  00006df8 00000000 00000000 DEBUG
 15 .debug_ranges   0001d2d8 00000000 00000000 DEBUG
 16 .debug_str      000e4147 00000000 00000000 DEBUG
 17 .comment        00000099 00000000 00000000
 18 .ARM.attributes 00000032 00000000 00000000
 19 .debug_frame    0001466c 00000000 00000000 DEBUG
 20 .debug_line     00049f95 00000000 00000000 DEBUG
 21 .debug_loc      0000141b 00000000 00000000 DEBUG
 22 .symtab         00001ec0 00000000 00000000
 23 .shstrtab       000000fb 00000000 00000000
 24 .strtab         000035f6 00000000 00000000
cargo objdumb and rust-objdump tools use llvm's objdump tool.
Some terminals do not parse parameters proxied to llvm-objdump command.
If this happens please use llvm-objdump script directly like so
llvm-objdump <path_to_binary> --section.headers
Empty firmware
An empty firmware is a piece of software running on a device that boots and puts the device in an endless loop. To boot, the firmware has to perform the following:
- do not depend on the standard library (
#![no_std]) - do not provide the standard
mainfunction called by the operating system (#![no_main]) - provide the
.start_blockand.end_blocksections (or.bootloaderfor the Pico 1); - provide the
.interrupt_vectorsection with pointers to interrupts; - copy the DATA sections from Flash to the correct address in RAM;
- initialize the BSS section in RAM with 0 values
- jump to the
mainfunction and never return.
- STM32 Nucleo-U545RE-Q
- Raspberry Pi Pico 2
- Raspberry Pi Pico
The .interrupt_vector section
On STM32 devices, the interrupt vector table is provided by the cortex-m-rt crate. Importing this crate is enough to provide a valid vector table with reset, fault, and interrupt handlers.
#![no_std]
#![no_main]

// we use as _ to avoid a compiler warning
// saying that the crate is not used
use cortex_m_rt as _;
The main function
In bare-metal Rust, there is no operating system to initialize memory or call main. The cortex-m-rt crate provides the #[entry] macro, which generates the startup code: it copies .data from FLASH to RAM, zeros .bss, sets up the stack, and then calls your entry function.
use cortex_m_rt::entry;

#[entry]
fn main() -> ! {
    // Your firmware starts here.
    loop {}
}
The important aspect is the usage of the #[entry] macro,
while the name of the function does not need to be main.
The entry! macro will rewrite the main function and add all the initialization code.
Different frameworks like embassy-rs will use different entry macros.
The .interrupt_vector section
The .interrupt_section is provided by rp235x_hal crate (or rp2040_hal for the Pico 1).
Importing this crate is enough to provide a valid interrupt vector.
#![no_std]
#![no_main]

// we use as _ to avoid a compiler warning
// saying that the crate is not used
use rp235x_hal as _;
The .start_block and .end_blocks
The rp235x_hal crate provides the valid .start_block and .end_block.
use rp235x_hal::block::ImageDef;

#[unsafe(link_section = ".start_block")]
#[used]
pub static IMAGE_DEF: ImageDef = ImageDef::secure_exe();
Older Rust versions do not require unsafe around the link_section attribute.
This code creates a static variable IMAGE_DEF of type ImageDef and places it
in the .start_block section, a dedicated section for bootloader
or secure boot metadata. The #[used] attribute ensures the variable is
included in the binary, even if it isn't directly referenced,
which is crucial for secure boot functionality or other boot-related processes.
The secure_exe function creates a .start_block that instructs the BOOTROM of the
Raspberry Pi Pico 2 to start the firmware in secure execution mode. The processor
always starts in secure execution mode and has to be switched to unsecure mode
by the firmware.
The #[used] attribute is important as linkers will discard code that is
not used to lower the size of the binary. The IMAGE_DEF variable is not
directly used by anything in the firmware and might be discarded.
The .end_block is automatically inserted by the linker using the memory.x file.
The main function
When writing software that runs on top of an operating system, the operating system
is responsible for initializing the memory of the software and the calling
of the main function.
Embedded firmware that does not run on top of an operating system has to perform the
memory initialization tasks and calling the main function itself.
The Rust Embedded Working Group provides a crate called cortex_m_rt (Cortex-M Runtime) that
exposes the macro entry! to perform these tasks. The macro is placed on top of a function
that takes no parameters and does no return (!).
use cortex_m_rt::entry;

#[entry]
fn main() -> ! {
  loop {}
}
The important aspect is the usage of the #[entry] macro,
while the name of the function does not need to be main.
The entry! macro will rewrite the main function and add all the initialization code.
Different frameworks like embassy-rs will use different entry macros.
The .interrupt_vector section
On the RP2040, the interrupt vector table is provided by the rp2040-hal crate. Simply importing this crate is enough to provide a valid interrupt vector table.
#![no_std]
#![no_main]

// we use as _ to avoid a compiler warning
// saying that the crate is not used
use rp2040_hal as _;
The .start_block and .end_blocks
The rp235x_hal crate provides the valid .start_block and .end_block.
use rp2040_hal::rom_data::ImageDef;

#[unsafe(link_section = ".start_block")]
#[used]
pub static IMAGE_DEF: ImageDef = ImageDef::default();
Older Rust versions do not require unsafe around the link_section attribute.
This code creates a static variable IMAGE_DEF of type ImageDef and places it
in the .start_block section, a dedicated section for bootloader
or secure boot metadata. The #[used] attribute ensures the variable is
included in the binary, even if it isn't directly referenced,
which is crucial for secure boot functionality or other boot-related processes.
The secure_exe function creates a .start_block that instructs the BOOTROM of the
Raspberry Pi Pico 2 to start the firmware in secure execution mode. The processor
always starts in secure execution mode and has to be switched to unsecure mode
by the firmware.
The #[used] attribute is important as linkers will discard code that is
not used to lower the size of the binary. The IMAGE_DEF variable is not
directly used by anything in the firmware and might be discarded.
The .end_block is automatically inserted by the linker using the memory.x file.
The main function
When writing software that runs on top of an operating system, the operating system
is responsible for initializing the memory of the software and the calling
of the main function.
Embedded firmware that does not run on top of an operating system has to perform the
memory initialization tasks and calling the main function itself.
The Rust Embedded Working Group provides a crate called cortex_m_rt (Cortex-M Runtime) that
exposes the macro entry! to perform these tasks. The macro is placed on top of a function
that takes no parameters and does no return (!).
use cortex_m_rt::entry;

#[entry]
fn main() -> ! {
    // Your firmware starts here.
    // For now, just loop forever.
    loop {}
}
The important aspect is the usage of the #[entry] macro,
while the name of the function does not need to be main.
The entry! macro will rewrite the main function and add all the initialization code.
Different frameworks like embassy-rs will use different entry macros.
Flashing firmware
To run firmware on the STM32 Nucleo-U545RE-Q or Raspberry Pi Pico 2, the compiled program must be transferred to the device's flash (non-volatile) memory. This process is called flashing, and it ensures that the firmware remains on the device even after a power reset.
A flashing tool is software that communicates with the device through a debug probe or other interfaces, such as USB or UART, to write the firmware to the correct memory location. Many flashing tools also verify the uploaded firmware to ensure data integrity and provide additional features like chip erasing or memory protection configuration.
When developing Rust firmware for the STM32 Nucleo-U545RE-Q or Raspberry Pi Pico 2, probe-rs is the
preferred flashing tool to upload and debug code.
After building the firmware using cargo build, an ELF file will be generated in
target/thumbv8m.main-none-eabihf/debug/$app_name. This file can be flashed to the
board using:
- STM32 Nucleo-U545RE-Q
- Raspberry Pi Pico 2
probe-rs run --chip STM32U545RETxQ target/thumbv8m.main-none-eabihf/debug/$app_name
probe-rs run --chip RP235x target/thumbv8m.main-none-eabihf/debug/$app_name
Replace $app_name with the name of the firmware's crate, usually the name of the folder where the firmware source resides.
Using cargo run
On a computer, running a Rust program with cargo run compiles the source
code into an executable and immediately starts it. This command streamlines
development by combining compilation and execution into a single step.
A similar process applies when using cargo run to develop firmware for the STM32 Nucleo-U545RE-Q or Raspberry
Pi Pico 2. Instead of just compiling and running a program on the host computer,
cargo run cross compiles the firmware and flashes it onto the target device in one
step. Under the hood, it uses probe-rs to detect the connected debug probe
and handle the flashing process automatically. This eliminates the need for
separate flashing tools, making firmware development as seamless as running a
Rust program on a computer.
To be able to use cargo run for flashing firmware, a runner has to be specified in the
.cargo/config.toml file. The following lines have to be added.
- STM32 Nucleo-U545RE-Q
- Raspberry Pi Pico 2
[target.'cfg(all(target_arch = "arm", target_os = "none"))']
runner = "probe-rs run --chip STM32U545RETxQ"
[target.'cfg(all(target_arch = "arm", target_os = "none"))']
runner = "probe-rs run --chip RP235x"
This setup makes flashing firmware to the Raspberry Pi Pico 2 as simple as running a Rust program on a computer.
Make sure the correct [target] is specified in the .cargo/config.toml configuration file. See the
cross-compiling section.
This setup makes flashing firmware to the STM32 Nucleo‑U545RE‑Q or the Raspberry Pi Pico 2 as simple as running a Rust program on a computer.
Printing messages
When developing embedded applications, debugging can be challenging due to
the lack of standard output (such as println!). Printed messages need to be generated
on the target device and sent to the host computer
where they are displayed to a console.
Two common techniques to
retrieve debug information from an embedded system are semihosting and
defmt. Both methods provide insight into program execution but work
differently and are suited for different use cases.
Semihosting
Semihosting is a debugging mechanism that allows an embedded system to communicate with a host computer via a debugger. It enables operations like:
- printing debug messages (
println!) - reading input from the host
Semihosting requires a hardware debugger.
This works in there steps:
- The embedded firmware executes a special semihosting instruction.
- The debugger software (e.g.,
gdbwithprobe-rs) intercepts the request. - The debugger software processes the request and returns the result to the firmware.
Semihosting is very simple to implement, but has a big drawback, it is slow and cannot be used in production.
Printing a panic message takes more than 2 seconds.
Printing a message
Semihosting for Cortex-M is implemented by the cortex_m_semihosting crate. This
exposes the hprintln!, a macro used for printing messages to the host system.
This macro behaves like println!, but instead of
printing to the terminal, it sends the output to the debugger, which then
transmits it to the host system.
#![no_std]
#![no_main]

use cortex_m_rt::entry;
use cortex_m_semihosting::hprintln;

#[entry]
fn main() -> ! {
  hprintln!("Device has started");
  // write the rest of the code here
  loop {}
}
The main advantage of semihosting is that it works with all the embedded frameworks.
Printing the panic
The Rust language provides a special function called the panic handler that gets called in case things go wrong. For instance attempting to divide to 0 will call the panic handler.
In embedded systems, the panic handler is used to handle unexpected runtime errors.
Using hprintln! in the panic handler allows developers to print helpful debug
messages when the program encounters a panic, making it easier to solve issues.
When using #![no_std], developers have to define their own panic handler.
#![no_std]
#![no_main]

use cortex_m_rt::entry;
use cortex_m_semihosting::hprintln;
use core::panic::PanicInfo;

#[entry]
fn main() -> ! {
    // Trigger a panic by dividing by zero (for demonstration purposes)
    let result = divide(23, 0);
    hprintln!("Result: {}", result);

    loop {}
}

// Divide the two given numbers
fn divide(a: u32, b: u32) -> u32 {
    a / b
}

// Define the panic handler
#[panic_handler]
fn panic(info: &PanicInfo) -> ! {
    // Print a panic message
    hprintln!("Panic occurred: {:?}", info);

    // Enter an infinite loop to halt the system after a panic
    loop {}
}
The divide_by_zero function is intentionally written to trigger a panic
(dividing by zero).
- the panic_handler is defined using the
#[panic_handler]attribute, when a panic occurs, this handler will be called; - inside the panic_handler,
hprintln!is used to print the panic message (Panic occurred: ...) to the host system via semihosting. - the program enters an infinite loop (
loop {}) to halt the system after a panic, preventing the device from continuing to run.
Panic handlers are usually defined by the frameworks. embassy-rs does define its own panic handler.
Using defmt
Another drawback of semihosting is that all the strings used in the debug messages are stored into the firmware's DATA sections and are flashed to the device. All the formating of these strings is done by the device.
The defmt crate is a compact logging framework
designed for Rust-based embedded systems. Its name comes from Deferred Formatting. Instead of sending full log messages,
it transmits compressed binary data, which is later decoded on the host.
This works in two steps:
- the firmware sends compressed log data via a debug probe (e.g., using
probe-rs) or another transport like UART (serial port); - the host tool (
defmt-print) decodes the data and prints human-readable logs.
Using defmt implies working with its own printing macros:
error!used for logging errors, that mean that the firmware cannot conitnue to correctly run;warn!used for logging warning messages, that are usually recoverable errors, and the framework can continue to run correctly;info!used for logging information messages;debug!used for logging debug messages that should not be displayed under normal functioning;trace!used for logging almost all the actions of the firmware, messages that should be enabled only when the firmware does not work correctly and needs detailed debugging.
When using defmt on Cortex-M devices, you must enable the critical-section-single-core feature of the cortex-m crate. This feature provides the synchronization primitives (critical-section implementation) that defmt relies on to ensure safe logging in interrupt-driven environments.
If you forget to enable this feature, the linker will fail with an error because the required synchronization symbols are missing.
  = note: rust-lld: error: undefined symbol: _critical_section_1_0_acquire
          >>> referenced by lib.rs:202 (/Users/user/.cargo/registry/src/index.crates.io-1949cf8c6b5b557f/critical-section-1.2.0/src/lib.rs:202)
          >>>               defmt_rtt-2e5f4d6c7462fd7b.defmt_rtt.985b52c98b8f2f50-cgu.0.rcgu.o:(defmt_rtt::RttEncoder::acquire::hca10ac2a388a637d) in archive /Users/user/projects/lab1/target/thumbv8m.main-none-eabihf/debug/deps/libdefmt_rtt-2e5f4d6c7462fd7b.rlib

          rust-lld: error: undefined symbol: _critical_section_1_0_release
          >>> referenced by lib.rs:219 (/Users/user/.cargo/registry/src/index.crates.io-1949cf8c6b5b557f/critical-section-1.2.0/src/lib.rs:219)
          >>>               defmt_rtt-2e5f4d6c7462fd7b.defmt_rtt.985b52c98b8f2f50-cgu.0.rcgu.o:(defmt_rtt::RttEncoder::release::h88de2c91fd62d36c) in archive /Users/user/projects/lab1/target/thumbv8m.main-none-eabihf/debug/deps/libdefmt_rtt-2e5f4d6c7462fd7b.rlib
To fix this, update your Cargo.toml like so:
[dependencies]
cortex-m = { version = "0.7.7", features = ["critical-section-single-core"] }
defmt = "1.0.1"
This ensures that defmt can safely coordinate access to its internal buffers on single-core Cortex-M microcontrollers.
Transports
One of the key features of defmt is its flexible transport system, allowing developers
to choose how the log data is transmitted.
Here, we'll highlight RTT (Real-Time Transfer) and UART.
RTT is one of the most powerful transport solutions for embedded debugging. It is a high-speed communication protocol that allows log data to be sent from the embedded system to the host system in real time. RTT works through the debugger's SWD (Serial Wire Debug) interface, which allows communication between the device and the host without requiring an additional UART or USB connection.
Using RTT requires a debugger.
RTT has several key advantages over traditional UART. It offers much higher data transfer speeds, making it ideal for applications that need frequent log output or high-throughput debugging. Moreover, RTT doesn't require a separate serial interface or special drivers on the host system, as the debugger itself handles the communication. The real-time nature of RTT is perfect for debugging critical, time-sensitive systems.
UART is one of the oldest and most commonly used serial communication protocols
in embedded systems. It’s well-supported by almost every microcontroller and
platform, and it provides a straightforward way to send log data to a host system.
In the context of defmt, UART can be used to transmit log data as ASCII or
binary over a serial connection, where it is then decoded by a terminal or
host application.
While UART is slower than RTT, it remains a popular solution due to its simplicity and widespread availability. It can be easily set up on most microcontrollers and is supported by many USB-to-serial adapters, making it accessible for both beginners and experienced developers. However, it has limitations in terms of speed and real-time debugging capabilities, especially in cases with large log outputs or higher data transfer requirements.
Example
This example demonstrates how to use defmt for logging in an embedded system,
handle panics, and send log messages over RTT.
#![no_std]
#![no_main]

use cortex_m_rt::entry;
use defmt::{error, info};
// use RTT for defmt transport
use defmt_rtt as _;
use cortex_m as _;
use core::panic::PanicInfo;

#[entry]
fn main() -> ! {
  info!("Device has started");
  panic!("panic here");
}

#[panic_handler]
fn panic(info: &PanicInfo) -> ! {
    error!("{:?}", info);
    loop {}
}
The defmt crate is used for logging, and two macros are employed in this example: info! and error!. The info! macro is used to log informational messages, such as when the device starts up. The error! macro is used in the panic handler to log error messages if the system encounters a panic.
The logging data is transmitted via RTT using the defmt_rtt crate, which is imported but not explicitly called.
The use of RTT enables real-time, high-speed communication between the embedded system and the host,
making it suitable for debugging in time-sensitive applications.
In the main function, the program begins by logging the message "Device has started" with the info! macro.
Following this, the panic! macro is called, simulating a panic condition. This could be triggered for various
reasons, such as an unexpected error or failed condition in the embedded system.
The panic handler logs the panic information using the error! macro. The info parameter passed to the panic handler contains details about the panic, which are logged for debugging purposes.
After logging the error, the program enters an infinite loop (loop {}) to prevent further execution,
effectively halting the system in a controlled manner. This is a common pattern in embedded systems when
handling critical errors or panics.
Filtering messages
Messages printed by defmt can be filetred using the DEFMT_LOG environemnt variable. The value
of this variable represents the lowest priority type of message the will be printed.
| Message | Priority |
|---|---|
trace! | 0 |
debug! | 1 |
info! | 2 |
warn! | 3 |
error! | 4 |
The DEFMT_LOG variable has to be set during the build.
To avoid setting this variable at every build, a .cargo/config.toml entry can be used.
[env]
DEFMT_LOG = "debug"
This example will ask cargo run to only print messages with a priority higher or equal to debug!.
Semihosting and defmt
This table show the advantages and disadvantages of both methods.
| Feature | Semihosting | defmt |
|---|---|---|
| Performance | Slow (halts CPU) | Fast (minimal overhead) |
| Output Format | Plain text (hprintln!) | Compressed binary logs |
| Debugger Required? | Yes | No (can use other transports) |
| Memory Usage | High (standard Rust formatting) | Low (compact binary format) |
| Use Case | Debugging with full text output | Real-time logging on embedded devices |
Editor Setup
When working on embedded Rust projects (like our STM32U5 or RP2 firmware), having a well‑configured editor makes development smoother and debugging less painful. Here are three excellent options — Visual Studio Code, Zed, and Helix — with setup instructions and recommendations.
- Visual Studio Code
- Zed
- Helix
VS Code is the most popular choice for embedded Rust because of its rich extension ecosystem and debugging support.
Create a file .vscode/settings.json:
{
  "rust-analyzer.cargo.allTargets": false,
  "[rust]": {
    "editor.defaultFormatter": "rust-lang.rust-analyzer",
    "editor.formatOnSave": true,
    "editor.formatOnSaveMode": "file"
  }
}
Make sure to disable allTargets in rust-analyzer as shown above, otherwise it will try to build host + embedded targets and flood you with errors.
You can find all the files you need here.
Zed is a lightweight, modern editor with built‑in Rust support and a focus on speed.
Create a file .zed/settings.json:
{
"lsp": {
  "rust-analyzer": {
    "initialization_options": {
      "cargo": {
        "target": "thumbv8m.main-none-eabihf",
        "allTargets": false
      }
    }
  }
},
"inlay_hints": {
  "enabled": true
  }
}
Remember to set allTargets: false in Zed’s LSP config to avoid host build errors.
You can find all the files you need here.
Helix is a modal editor (like Vim/Neovim) with first‑class LSP support and a Rust‑friendly workflow.
Create a file file .helix/languages.json:
[[language]]
name = "rust"

[language-server.rust-analyzer.config.check]
targets = ["thumbv8m.main-none-eabihf"]
allTargets = false
Be sure to add allTargets = false in languages.toml so rust-analyzer doesn’t try to build every target.
You can find all the files you need here.
Exercises
- Create a new project using
cargo init. Configure the project using a configuration file to build for the lab board's target. Test it by runningcargo build. Take a look at Cross-compiling(1p).
All you have to do is to make sure you are building a binary that does not depend on std, has no main function and provides an empty panic handler.
To prevent rust-analyzer from showing an error on the first line and to automatically format your source when saving, make sure to properly setup the editor.
- Inspect the binary and figure out what sections are missing. Explain why each of the sections is missing. take a look at Inspect binaries. (1p)
- Add the
cortex-m-rtcrate to your project and define a function as an entry point for your firmware. Inspect the binary and see which of the required sections are present. (1p)
The cargo add command adds crates to a project.
- Write a linker script to add the correct sections to your binary. Take a look at Linker script. Inspect the binary and check if the required sections are present. (1p)
- Write the build script to instruct the linker to use the linker script. Take a look at Build script. Inspect the binary and see if the required sections are present. Is one of the sections missing? (1p)
Make sure that the build script only uses linker scripts that exist in the project.
Some crates, like cortex-m-rt and defmt provide linker scripts.
- Print a message from the main function using semihosting. Try running
the firmware using
probe-rs run target/...$app_name. Why doesn't it work? Take a look at Semihosting (1p). - Create a
memory.xfile for your STM32U545 project that defines the FLASH and RAM regions. Build the project and inspect the ELF map to confirm that the vector table is placed at0x0800_0000and that the stack pointer is set to the top of RAM. (1p) - Use semihosting to print the panic message in the panic handler. Use the
panic!macro to generate a panic. Take a look at Printing the panic (1p). - Use the
defmtanddefmt_rttcrates to printinfo!anderror!messages. Generate a panic to verify the error message. Take a look at Usingdefmt(1p)
- Make sure you add all the necessary linker scripts to the
build.rsbuild script. - Make sure you set the
DEFMT_LOGvariable toinfowhen building to see theinfomessages or use the.cargo/config.tomlfile (take a look at Filtering Messages). - Messages are printed together with the location where the message was issued. To supress this
use the
--no-locationparameter forprobe-rs run.
- Use the
panic-probecrate to display better panics. (1p)
- This crate provides a panic handler.
- Enable the
print-defmtfeatures ofpanic-probeto usedefmtto print panics.
- Make the necessary configuration so that you can use
cargo runto flash the firmware. Take a look at Usingcargo run(1p)
You can add the --no-location parameter to the runner.
VS Code probe-rs Extension
The probe-rs extension for Visual Studio Code is a powerful tool designed to streamline
the development and debugging of embedded Rust applications. It provides a seamless experience
for flashing firmware, setting breakpoints, and inspecting memory on embedded devices,
including the STM32 Nucleo-U545RE-Q, Raspberry Pi Pico 1 and Pico 2. By integrating with probe-rs, this extension
removes the complexity of configuring traditional debugging setups that rely on GDB and OpenOCD.
Using probe-rs within VS Code greatly simplifies the debugging workflow. Instead of manually
invoking command-line tools to flash firmware and debug, users can configure the extension via a
simple launch.json file. This configuration specifies the target chip, the firmware binary
to flash, and debugging options. Once set up, developers can start debugging with a
single click or by pressing F5, making the process efficient and user-friendly.
It integrates natively with defmt, allowing developers to view structured log messages
directly within VS Code’s terminal. This is especially useful for debugging
applications running on resource-constrained devices like the Raspberry Pi Pico 1 and Pico 2,
where traditional logging methods may be impractical.
Set up launch.json
VS Code's probe-rs extension uses a configuration file called launch.json located in the
.vscode folder of the project.
- STM32 Nucleo-U545RE-Q
- Raspberry Pi Pico 2
- Raspberry Pi Pico
{
    "version": "0.2.0",
    "configurations": [
        {
            "preLaunchTask": "rust: cargo build",
            "type": "probe-rs-debug",
            "request": "launch",
            "name": "STM32 Nucleo-U545RE-Q",
            "cwd": "${workspaceFolder}",
            "connectUnderReset": false,
            "chip": "STM32U545RETxQ",
            "flashingConfig": {
                "flashingEnabled": true,
                "haltAfterReset": false,
            },
            "coreConfigs": [
                {
                    "coreIndex": 0,
                    "programBinary": "./target/thumbv8m.main-none-eabihf/debug/${workspaceFolderBasename}",
                    "svdFile": "./STM32U545.svd",
                    "rttEnabled": true,
                }
            ]
        }
    ]
}
{
    "version": "0.2.0",
    "configurations": [
        {
            "preLaunchTask": "rust: cargo build",
            "type": "probe-rs-debug",
            "request": "launch",
            "name": "Raspberry Pi Pico 2",
            "cwd": "${workspaceFolder}",
            "connectUnderReset": false,
            "chip": "RP235x",
            "flashingConfig": {
                "flashingEnabled": true,
                "haltAfterReset": false,
            },
            "coreConfigs": [
                {
                    "coreIndex": 0,
                    "programBinary": "./target/thumbv8m.main-none-eabihf/debug/${workspaceFolderBasename}",
                    "svdFile": "./rp2350.svd",
                    "rttEnabled": true,
                }
            ]
        }
    ]
}
{
    "version": "0.2.0",
    "configurations": [
        {
            "preLaunchTask": "rust: cargo build",
            "type": "probe-rs-debug",
            "request": "launch",
            "name": "Raspberry Pi Pico",
            "cwd": "${workspaceFolder}",
            "connectUnderReset": false,
            "chip": "RP2040",
            "flashingConfig": {
                "flashingEnabled": true,
                "haltAfterReset": false,
            },
            "coreConfigs": [
                {
                    "coreIndex": 0,
                    "programBinary": "./target/thumbv6m-none-eabi/debug/${workspaceFolderBasename}",
                    "svdFile": "./rp2040.svd",
                    "rttEnabled": true,
                }
            ]
        }
    ]
}
This launch.json file configures VS Code's probe-rs extension for debugging
firmware on the Raspberry Pi Pico. It defines how the debugger interacts
with the RP235x,RP2040 or the STM32U545 chip, including flashing, RTT support, and the
firmware's location.
The "version": "0.2.0" field specifies the configuration format. The
"configurations" array holds debug settings, with a single configuration
for the Pico.
Before debugging, "preLaunchTask": "rust: cargo build" ensures the firmware
is compiled. The "type": "probe-rs-debug" field tells VS Code to use
probe-rs as the debug backend. The "request": "launch" mode starts a
new debugging session. The "name" field labels this configuration.
The "cwd": "${workspaceFolder}" sets the working directory to the project
root. The "connectUnderReset": false prevents connecting while the device
is held in reset. The "chip": "RP235x","chip": "RP2040" or "chip": "STM32U545RETxQ" tells probe-rs which microcontroller
is in use.
The "flashingConfig" section controls how firmware is written to flash.
With "flashingEnabled": true, the firmware is flashed before debugging.
The "haltAfterReset": false allows execution to continue after reset.
The coreConfigs array defines how individual CPU cores are handled. Since
RP235x has multiple cores, this example configures core 0. The firmware
binary is loaded from ./target/thumbv8m.main-none-eabihf/debug/${workspaceFolderBasename}.
The "svdFile": "./STM32U545.svd" provides register descriptions for
debugging.
The "rttEnabled": true" setting enables Real-Time Transfer (RTT),
allowing debug output to be streamed efficiently without interfering with
program execution. This is used for reading the messages sent by defmt.
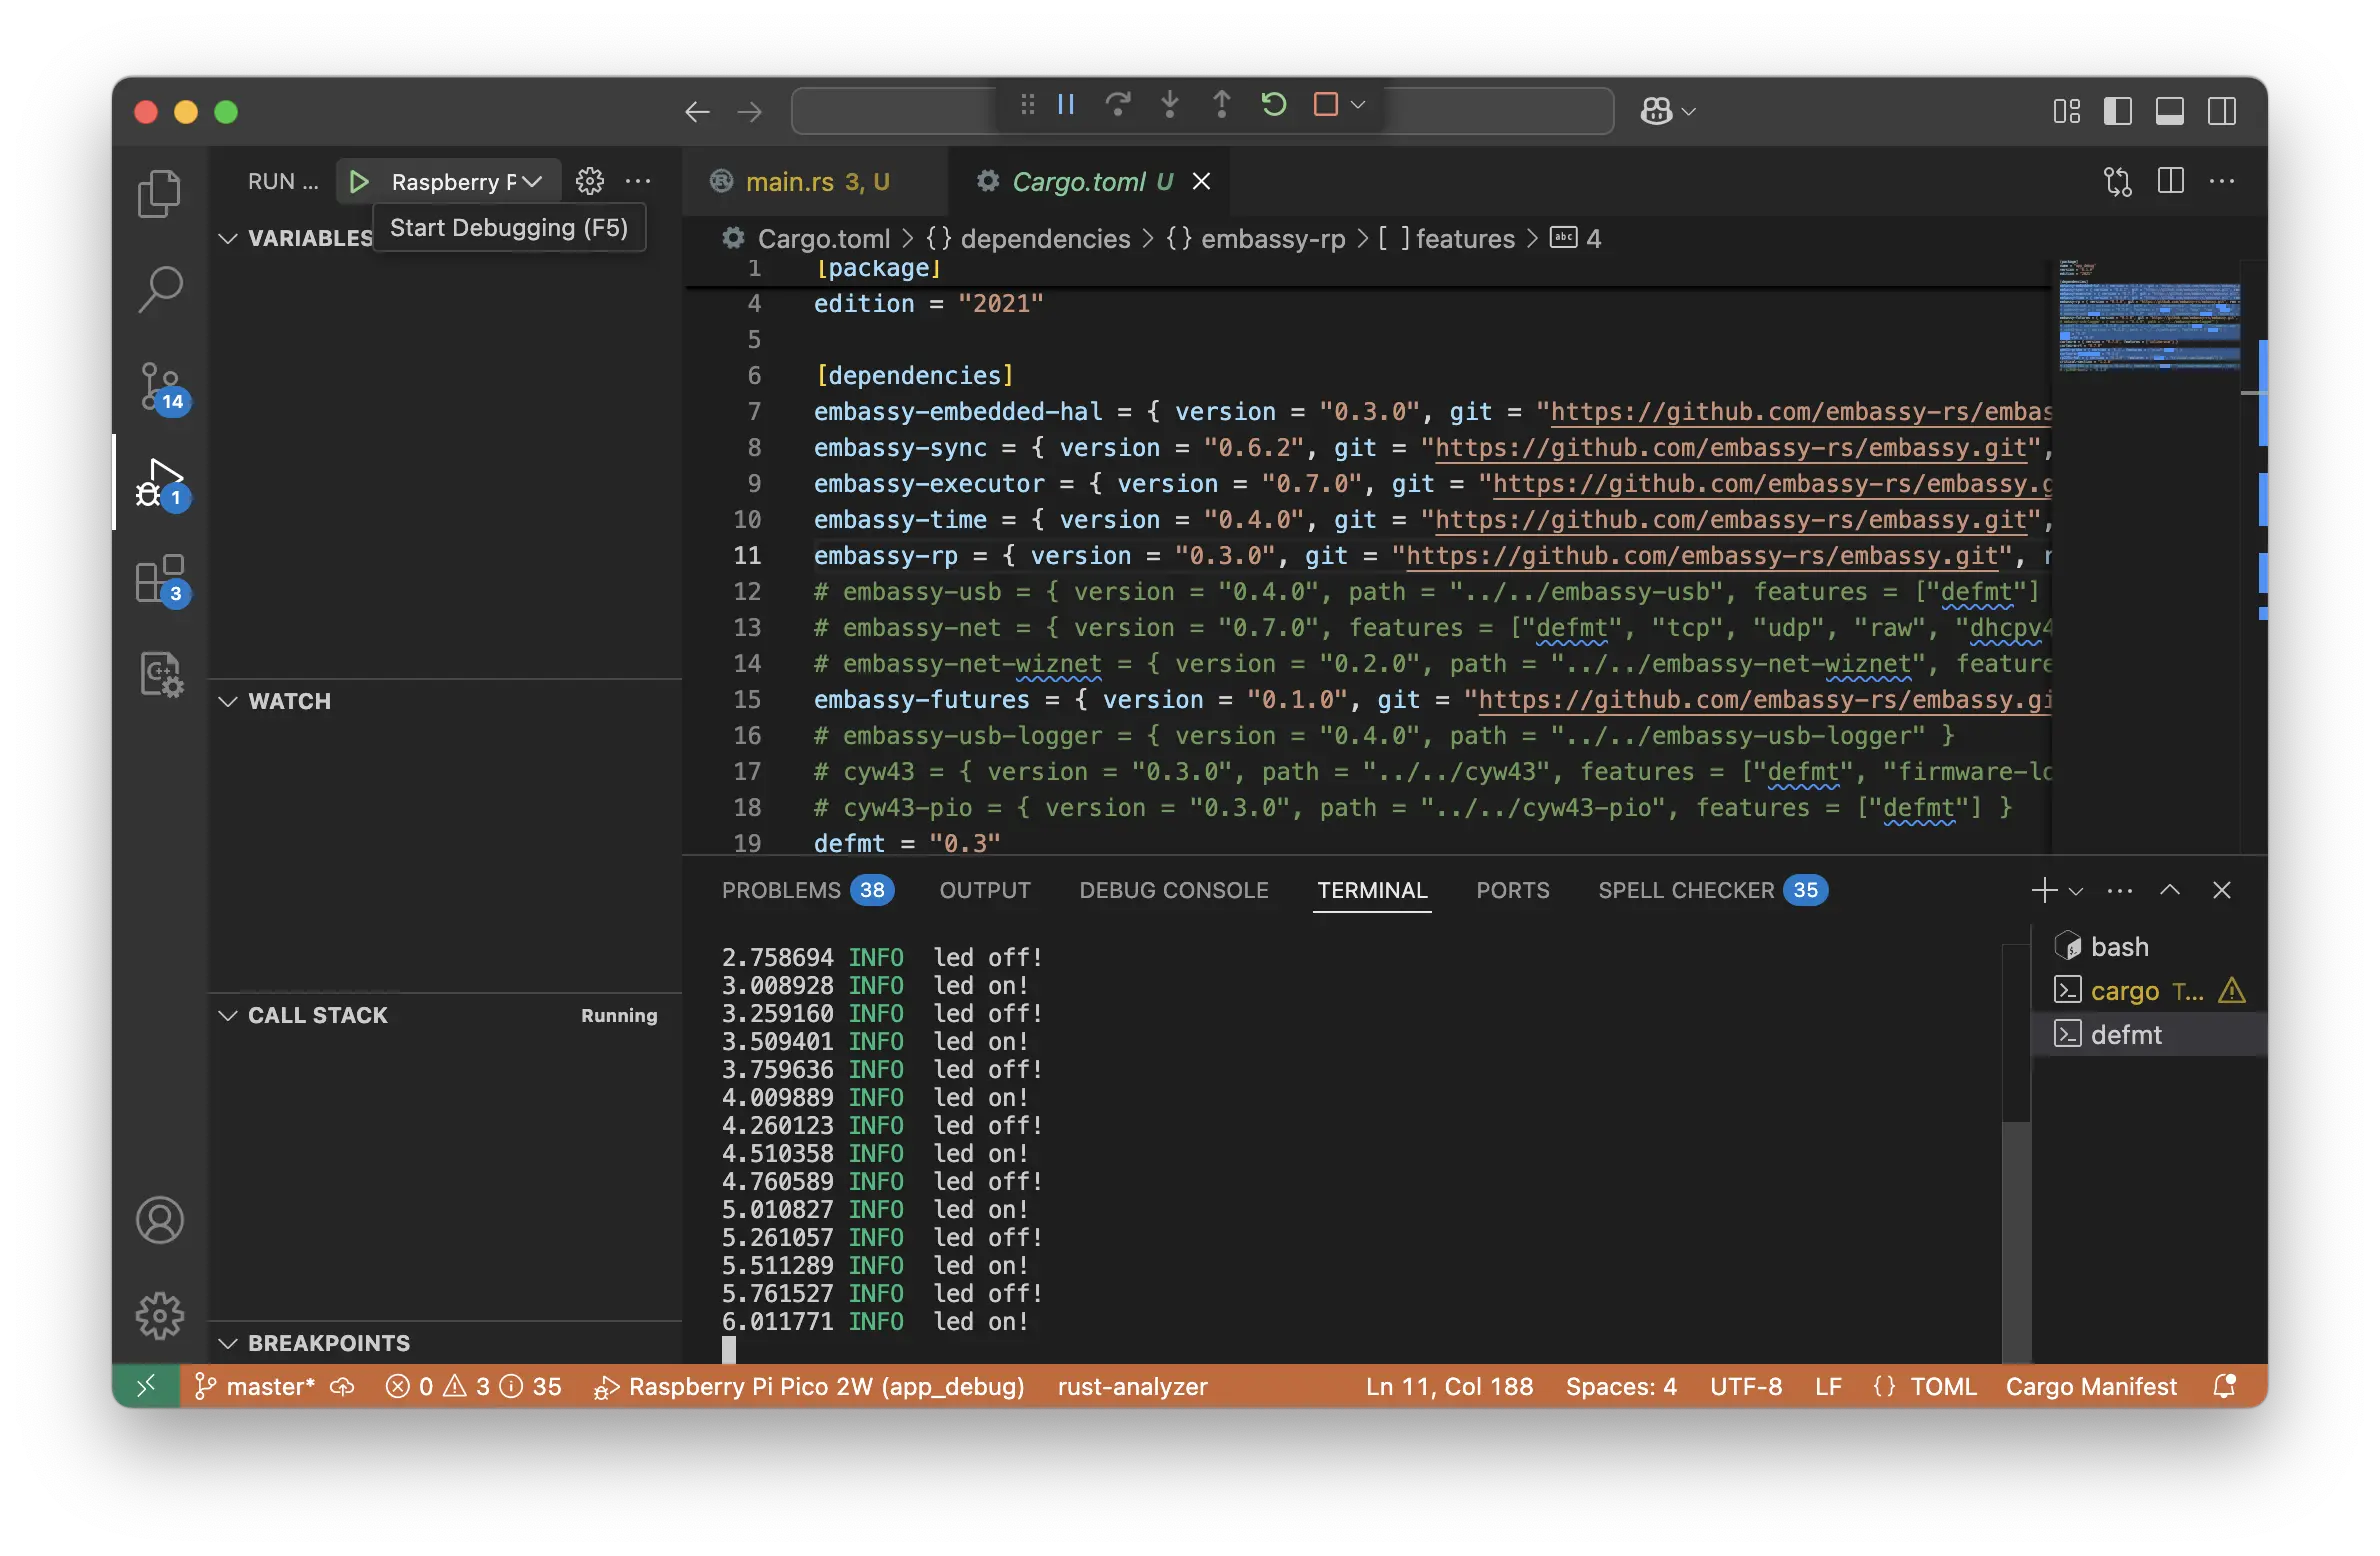
Running the firmware
This is how the probe-rs extension for VS Code UI looks like when
debugging firmware.
To run firmware on the STM32 Nucleo-U545RE-Q/Raspberry Pi Pico 1 or 2 using the probe-rs extension
in Visual Studio Code, open your project and ensure your launch.json
file is correctly configured. Before starting, connect
your debugger* to the Pico and power the board.
If you are using the lab board, please make sure you are using the USB-C connector.
Starting the Debugging Session
- Open the Run and Debug panel in VS Code by clicking the Run icon
in the left sidebar or pressingCtrl+Shift+D. - Select "Raspberry Pi Pico 2"/"NUCLEO-STM32U545" (or the name of your configuration) from
the drop-down menu at the top of the panel. - Click the Start Debugging button (▶), or press
F5.
The firmware will be flashed automatically if "flashingEnabled": true is
set in launch.json. Once the process completes, execution starts, and the
debugger attaches to the target.
Checking for Errors and Debug Output
If something goes wrong, look for errors in the PROBLEMS tab at the
bottom of VS Code. If flashing fails, check the TERMINAL or DEBUG
CONSOLE for probe-rs messages. Common issues include:
- The debug probe is not detected. Try reconnecting the hardware.
- The Pico is not powered on. Ensure proper connections.
- Flashing errors due to a missing or corrupted firmware binary.
If using defmt for logging, open the TERMINAL to see formatted
debug messages. If RTT is enabled ("rttEnabled": true), defmt output will
stream here in real-time.
Stopping the Running Firmware
To stop execution, press the Stop Debugging button (■) in the debug
toolbar or use the shortcut Shift+F5. This halts the processor and
disconnects the debugger. If the device is still running after stopping,
you may need to power-cycle the Pico to fully reset it.
Using Breakpoints
When debugging firmware on the Raspberry Pi Pico 1 and 2 using the probe-rs
extension in Visual Studio Code, breakpoints allow you to pause execution
at specific lines of code, while stepping lets you move through code
line-by-line to inspect its behavior.
Placing a Breakpoint
- Open the Rust source file you want to debug.
- Click in the gutter (left margin) next to a line of code where you want execution to pause. A red dot will appear, indicating an active breakpoint.
- Alternatively, place the cursor on a line and press
F9to toggle a breakpoint.
Breakpoints are only effective in code that is actually executed. If a breakpoint is placed on an unused function, it will be ignored.
Starting and Hitting a Breakpoint
- Start debugging with
F5(or the Start Debugging button in the Run and Debug panel). - When execution reaches a breakpoint, the program pauses at that line, allowing you to inspect variables and memory.
- Hover over variables to see their values or use the Variables panel in the Debug sidebar.
Stepping Through Code
When a breakpoint is hit, you can control execution using the Debug Toolbar:
- Step Over (
F10) → Executes the current line and moves to the next. If the line contains a function call, the function runs but isn’t entered. - Step Into (
F11) → Enters a function call to debug inside it. - Step Out (
Shift+F11) → Runs until the current function returns. - Continue (
F5) → Resumes execution until the next breakpoint or
program end.
Removing or Disabling Breakpoints
To remove a breakpoint, click the red dot again or press F9 on the
selected line. To temporarily disable a breakpoint, right-click it and
select Disable Breakpoint.
Using breakpoints and stepping makes it easier to understand how firmware
executes and diagnose issues efficiently in probe-rs with VS Code.
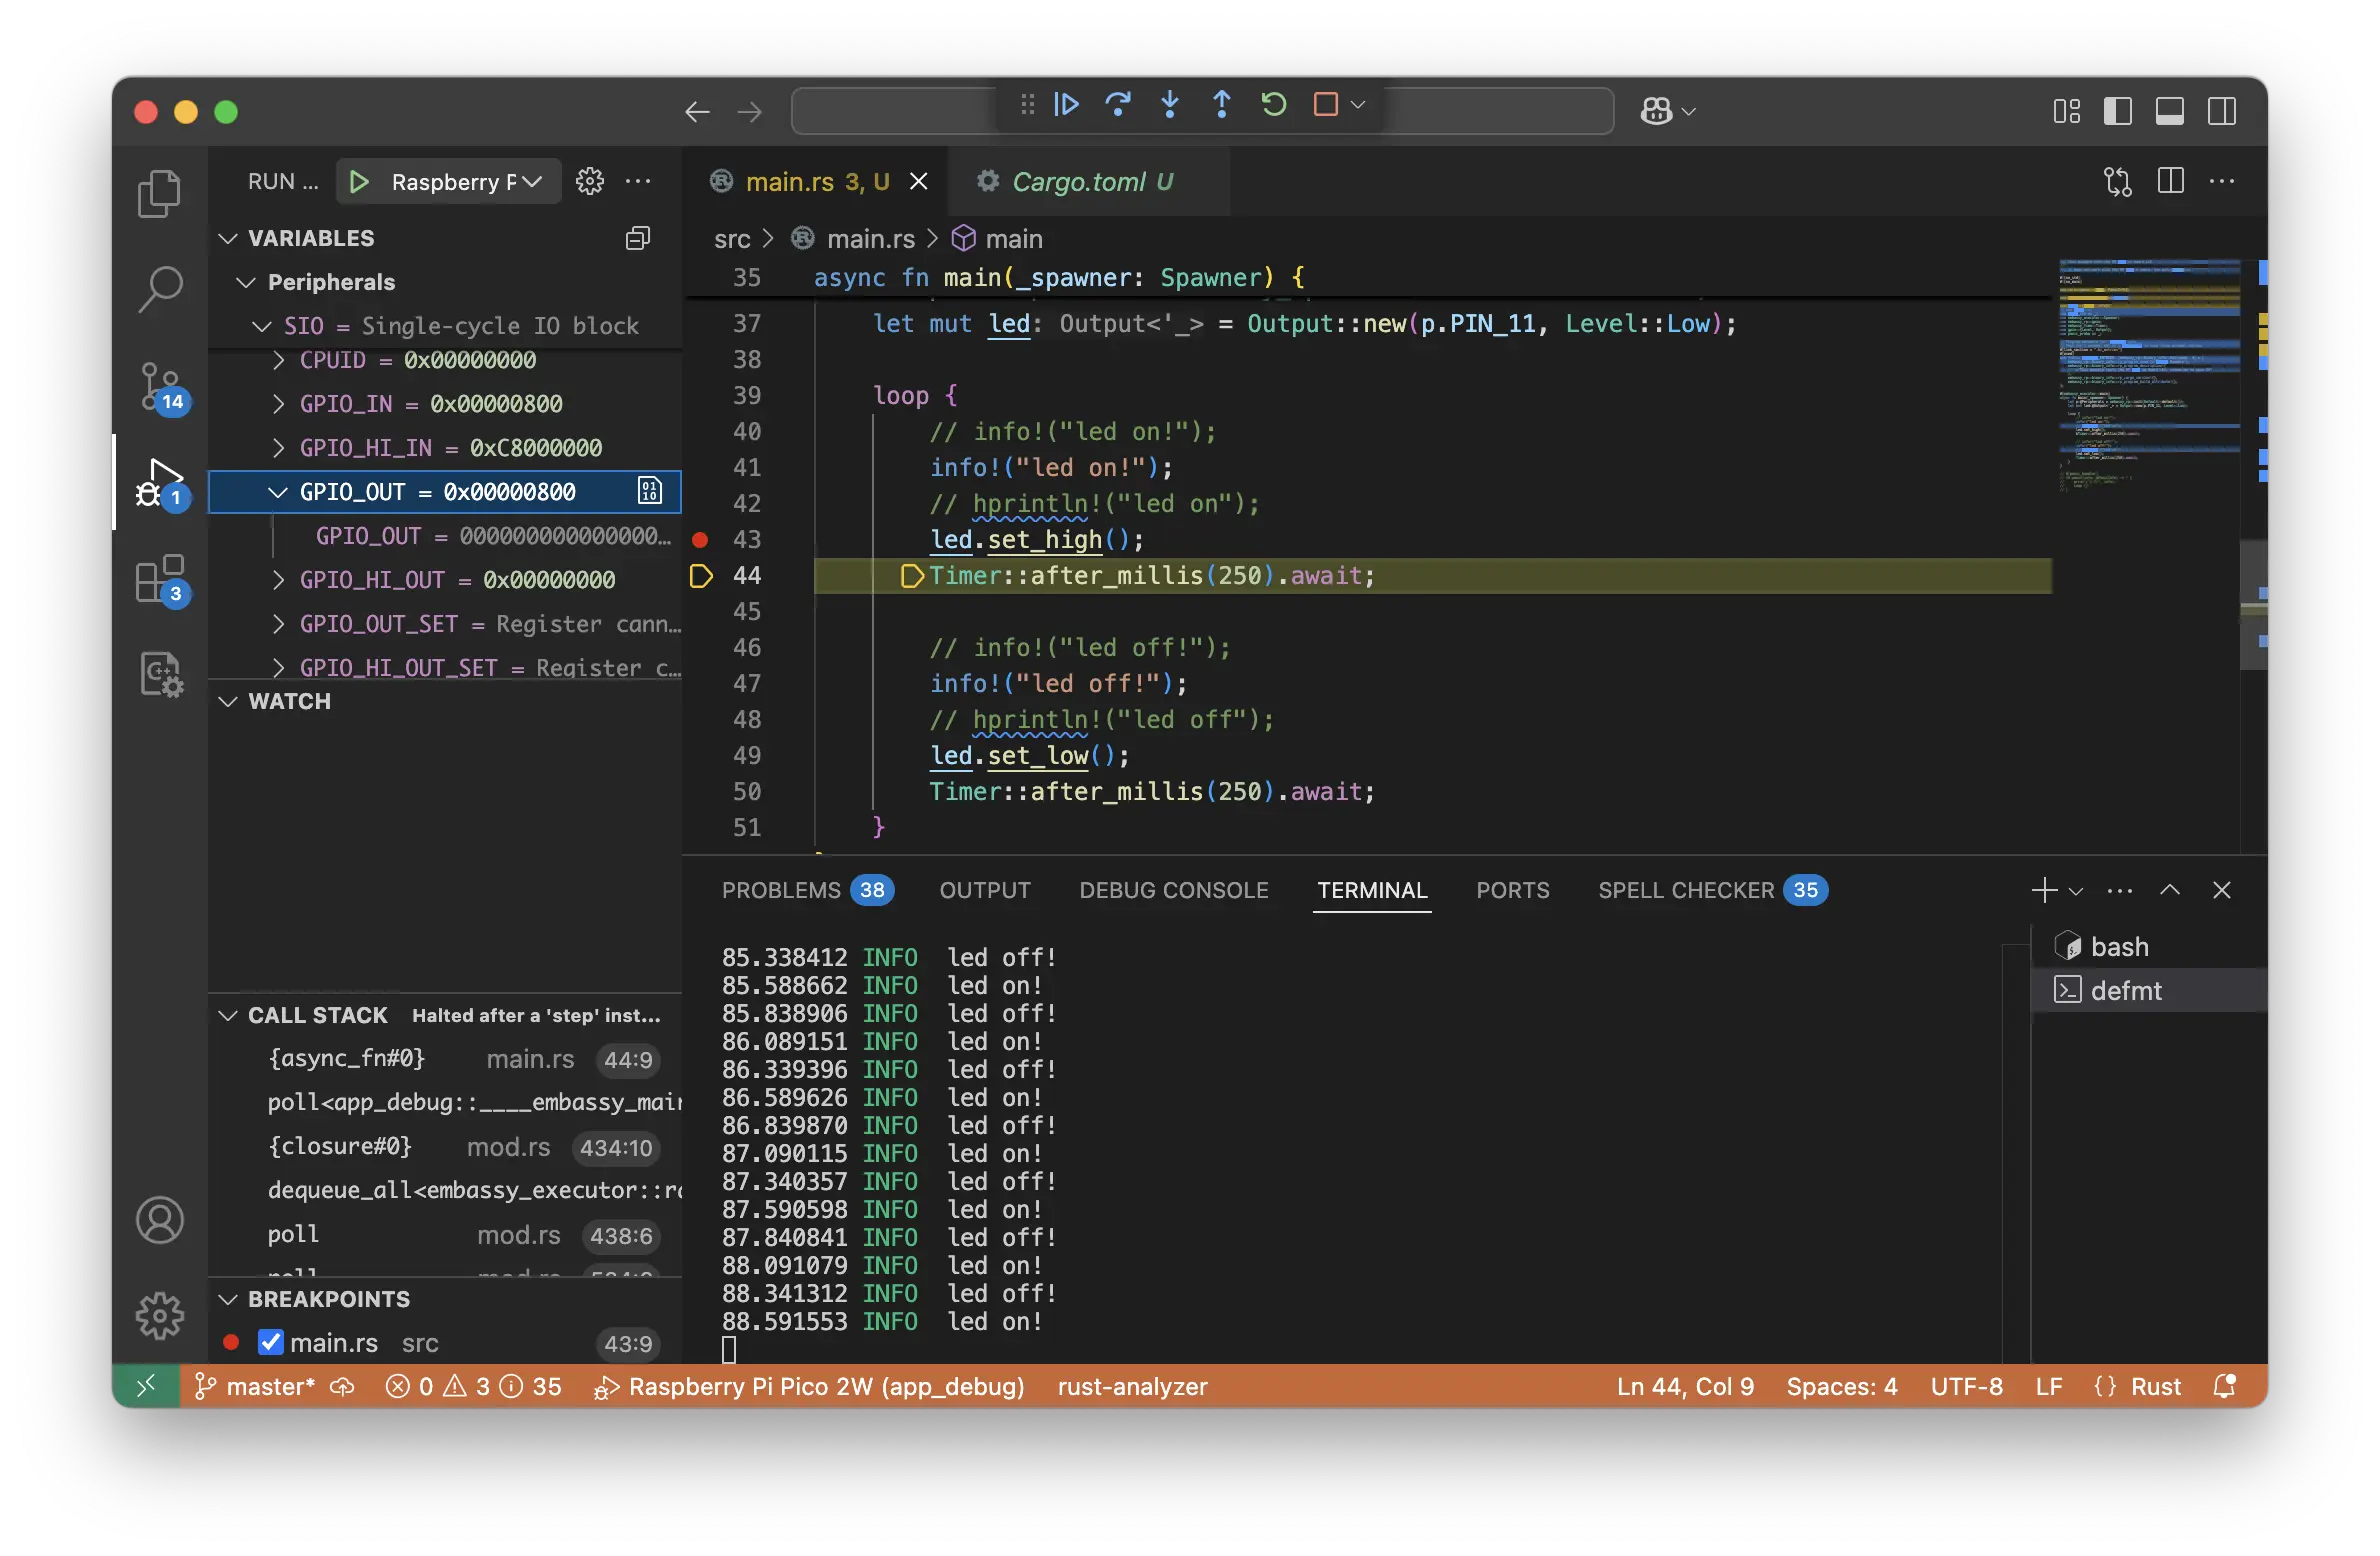
Watches
The probe-rs extension in VS Code provides powerful debugging tools
to inspect variables, function execution, and hardware registers while
developing firmware for the Raspberry Pi Pico 2.
The WATCH panel in VS Code allows developers to track specific variables and expressions while debugging. This is useful for monitoring register values, checking memory locations, and debugging complex logic.
- Start debugging (
F5) and hit a breakpoint where you want to inspect variables. - Open the WATCH panel in the Debug sidebar.
- Click "Add Expression" and enter a variable name or memory address.
- Example:
some_variable(for normal variables). - Example:
*(0xD0000014 as *const u32)(to read a register).
- Example:
- The expression updates each time the debugger stops.
Call Stack: Tracing Function Execution
The CALL STACK panel shows the sequence of function calls that led to
the current execution point. This is essential for understanding how the
program reached a specific line of code.
How to Use the Call Stack
- When execution stops at a breakpoint, check the CALL STACK panel.
- The top function is the currently executing function.
- Clicking on any function in the stack navigates to its source.
Why Use the Call Stack?
- Understand nested function calls (e.g., deep function recursion).
- Debug unexpected behavior by seeing which path the code took.
- Find where a panic originated in case of a crash.
Peripherals: Inspecting Hardware Registers
The Peripherals panel lets you inspect hardware registers based on the SVD (System View Description) file for the STM32U545RETxQ, RP235x or RP2040 chip. This allows direct observation of GPIO states, timers, UART, and more.
Please make sure that the project folder contains the correct SVD file.
SVD Files for The Raspberry Pi Pico
| Processor | Crate that provides the SVD File |
|---|---|
| RP2350 | rp235x_pac |
| RP2040 | rp2040_pac |
| STM32U545RETxQ | stm32-rs |
Make sure you download the .pacthed versions of the files.
How to Enable Peripheral Debugging
- Ensure
"svdFile": "./stm32u545.svd","svdFile": "./rp2350.svd"or"svdFile": "./rp2040.svd"is set inlaunch.json. - Start debugging and hit a breakpoint.
- Open the Peripherals panel in the Debug sidebar.
- Expand peripheral groups (e.g.,
GPIO,TIMER,UART) to see live register values.
Why Use the Peripherals Panel?
- Observe hardware state changes while stepping through code.
- Debug GPIO settings, clock configurations, and interrupts.
- Avoid manual memory reads by using structured register views.
Extra exercises
- Setup the
probe-rsVS Code Extension to run the firmare directly from Visual Studio Code. - Define a few variables throughout the firmware and perform some math. Use the
probe-rsVS Code extension to go step by step throughout the running firmware and look at the variables using the Watches. - Define a few fuctions throughout the firmware and perform some math. Use the
probe-rsVS Code extension to go step by step through the running firmware and look at the called functions using the Call Stack.
Solutions
The lab's exercises solutions are available in the lab-solutions repository.
Footnotes
-
Software that is running on microcontrollers is usually called firmware. The words is a combination of the words firm and software and means the software that the vendor firm of the device has uploaded. ↩